|
|
|
|
|
Click on image to enlarge. 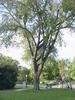

| |||||||||||||||||||||||||||||||||||||||||||||||||||||||||||||||||||||||||||||||||||||
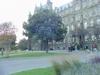
| Scientific name: : : : : Common Name: Information Sheet, Patrick Shen Country: USA Photographer: E. M. Barrows Identifier: E. M. Barrows The lush vegetation of Glover-Archbold Park (GAP) forest provides ample
grounds for recreation and study. Joggers take advantage of the many trails.
Residents often escape their hectic city schedules for strolls in the forest,
which may include walking the dog. Students of Georgetown University’s Forest
Ecology class utilize the GAP forest for educational nature walks and
independent study. The GAP forest is bordered by the highly artificial urban
forest of the Georgetown University Campuses. Highly developed and landscaped,
the sparse Campus forest pales in comparison to the thick population of trees
and other plants present in the GAP. Both the GAP forest and the GU urban forest
contain rich, yet very different plant biodiversities. In my studies in Forest
Ecology, I tested the hypotheses that the GU and GAP forests have similar
diversity indices and that they share enough species in common to share a high
Coefficient of Community. The GAP forest is an extension of a larger park known as Rock Creek Park. The
GAP is approximately 2.6 mi long and 0.25 mi wide at its widest area (Barrows
2003a). Charles C. Glover and Anne Archbold originally donated the GAP land to
Washington, D.C., in 1924. They intended that the land be used as a bird
sanctuary. In terms of plant biodiversity, the GAP still contains most, if not
all, of its many native species of trees. However, several species of alien
invasive plants have begun to overrun certain areas of the Park as well. These
species include Asiatic Bittersweet, Amur Honeysuckle, bamboo, English Ivy,
Garlic Mustard, Japanese Honeysuckle, Lesser Celandine, Multiflora Rose, privet,
Turf-lily, and Wineberry (Barrows 2003a). Because the GAP is a national park,
efforts have been made to meet the federal act mandate that aims to preserve the
natural state of the park (National Park Service 1999). The urban forest on Georgetown University’s Main Campus has been under
landscaping development since the University’s inception in 1789. Since then,
the on-campus urban forest has undergone many changes in many areas including
the North Lawn, Dahlgren Chapel, and the Observatory grounds (Barrows 2003) .
Changes have occurred as a result of university development, such as the
building of new dormitories (Barrows 2003b). Since about 1974, landscaping has
been under the charge of Michael Pontti, Georgetown University’s landscaping
foreman. Mr. Pontti began his work beautifying the Georgetown Campuses in the
early 1970’s (Barrows 2003b). When I asked him of his thinking behind his
landscaping design, he described his desire to incorporate a great variety of
both native and non-native plants on the Main and Medical Campuses.
Particularly, he enjoys importing strong plants from Asia, pointing out that
many parts of Asia are within a climate zone similar to the Georgetown. This
allows Asian plant life to grow and thrive in the environment of GU Campuses.
China, Japan, and Korea are the original source areas of many GU plants. He also
stated an aim towards plants with ornamental value, praising Asian plant species
for their unique and beautiful style. In analyzing the landscape, my study
looked at the North Lawn area of the Main Campus. This study aims to compare the biodiversity of GAP forest and the Main Campus
North Lawn through analysis of their respective species diversity and similarity
based on tree species common to both. Species diversity measures the number of
species and their relative abundances in a community (Lincoln et al. 1985).
Based on the information available, I expected that the North Lawn would bear
little or no resemblance to the GAP forest. Specifically, I expected the GAP to
contain fewer species relative to the North Lawn due to landscaping design that
aims to incorporate a wide variety of species on the North Lawn. Additionally,
since the GAP forest is significantly denser than the North Lawn urban forest, a
higher abundance of trees in the GAP forest is expected when compared to the
abundance of the North Lawn. Because both forests are geographically very close,
tree species common to both forests were probable. However, based on my
expectations of species number and abundance for each forest, I expected that a
low similarity exists between the GAP forest and the North Lawn, due to the fact
that the North Lawn is subject to landscape design. Materials and Methods Tree species on the Georgetown University Main Campus were identified
visually on the North Lawn. Tree keying techniques were used to identify tree
species. Dr. Barrows and Mr. Pontti were both consulted in identifying tree
species. Tree species identifications were performed on the North Lawn within an
area bound by the front of Lauinger Library, the front of the Healy Hall, the
front of Copley Hall, the brick wall behind White-Gravenor, and the front wall
of the North Lawn that separates that serves as the physical barrier between the
North Lawn and 37th Street. With regard to Red Square, the only trees
included in my study were the Japanese Maple (marked with a dedication plaque),
and the trees along the edge of White-Gravenor. I used common names of tree
species, and mapped trees in relation to each other on the North Lawn. Ideally,
trees should have been mapped to scale, in order to represent their precise
locations. However, the means needed to map tree positions to scale exceeded the
limitations of this study. The other men and I identified the trees and I
recorded the position and frequency of each tree species tallied. I obtained information on tree diversity in the GAP forest through a Forest
Ecology laboratory exercise on tree biodiversity within the GAP. The course is
taught by Dr. Barrows with Kyle Brown as teaching assistant. Dan Kjar, who is a
doctoral student studying with Dr. Barrows, was also a valuable reference.
Students analyzed transects in the GAP forest in three areas known as Ant Hill,
Glass Hill, and Spring Valley. Transects were each 200 ft, consisting of plastic
line with 1-ft markers. Students in the course were divided into four groups,
with each group’s analyzing single, different transects within each of the
three areas of the GAP forest. Trees included in the study had the following
characteristics: they lay within 3 ft on either side of the transect line, were
living, and had the potential to grow or already were over 15 ft in height or
already were over 15 ft in height. The class identified tree species and
recorded the frequency of each species. Both the Simpson’s Index of Diversity and the Coefficient of Community were
calculated for data sets obtained from both forests in order to compare
similarities and differences between the forests based on tree species richness
and abundance. The Simpson’s Index of Diversity (D) measures the diversity of
a sample, and is calculated as follows: The Simpson’s Index of Diversity ranges from 0 The Coefficient of Community (CC) measures the degree of similarity between two communities based on the number of species that they have in common, and is calculated as follows: CC = 2c/(a+b), where a = total number of taxa in community a, b = total number of taxa in community b, and c = number of taxa present in both communities.The Coefficient of Community ranges from 0 ¾1, with 0’s indicating no similarity between communities and 1’s indicating complete similarity (3).Results and Discussion Forty-six different species were identified on the North Lawn, with 244 total trees counted (Table 1). Their relative positions are mapped in Figures 1 and 2. The most abundant tree on the North Lawn is the Japanese Holly, followed by the Korean Spice Viburnum, the Siebold Viburnum, and the English Holly (Table 1). Other tree species with frequencies in the double digits included the Crape Myrtle and the Leatherleaf Viburnum (Table 1). Within the GAP forest, 25 species were identified, with 420 total trees counted (Table 2). In the GAP forest, the Spicebush was the most abundant tree species in the transects, followed by American Beech, the Tuliptree, and the Sugar Maple (Table 2). Other tree species with frequencies in the double digits included the American Elm, Arrowwood, Ash-leaved Maple, Eastern Sycamore, Red Maple, Staghorn Sumac, and White Ash (Table 2). Roughly, the GAP forest transects reported tree abundance that was twice that of the North Lawn, but with a species richness that was only half that of the North Lawn. Additionally, the GAP forest contains more tree species with frequencies in the double digits. The calculated Simpson’s Index of Diversity for the GAP forest is D = 0.871. The calculated Simpson’s Index of Diversity for the North Lawn is D = 0.928. The calculated Coefficient of Community between the GAP forest and the North Lawn is CC = 0.169, with both forests having six species in common. This study compared the biodiversity of GAP forest and the North Lawn urban forest of Georgetown University’s Main Campus. The results of this study support the initial expectations in regard to species diversity and similarity between the two forests. The study’s results support the hypotheses. Lower species diversity was expected in the GAP forest when compared to the North Lawn. This hypothesis was supported by the calculated Simpson’s Index of Diversity for both forests, with D = 0.871 for GAP forest and D = 0.928 for the North Lawn. Clearly, the North Lawn’s index of diversity is greater than the GAP, indicating greater species diversity within the North Lawn urban forest. This disparity can also be seen in Tables 1 and 2. The North Lawn clearly shows nearly double the number of tree species found in GAP forest. Additionally, higher abundance of trees was expected in the GAP forest relative to the North Lawn. A simple comparison of the total number of trees counted in both forests supports this hypothesis. The GAP forest transects had 420 trees, while the North Lawn has 244 trees, approximately half the total number of trees counted in GAP forest. Additionally, it is important to note that the reported diversity in the GAP stems from transects that account for only a portion of the total number of trees. The actual abundance of the GAP is conceivably much higher. Clearly, the GAP forest abundance is significantly higher than that of the North Lawn. In terms of similarity, the GAP forest and the North Lawn were expected to show a low degree of similarity. This hypothesis was supported by the calculated Coefficient of Community, where CC = 0.169. With this value close to 0, the CC indicates a very low degree of similarity between the two forests. It is interesting to note, however, that both forests display comparable species diversity indices (differing by less than 0.10), but have very low similarity through the CC test. In other words, each forest displays a large number of species, but mostly not in the same species. Future studies should work towards eliminating the errors due to limitations in time and resources. For instance, the sampling of GAP forest was done non-randomly, with only a small section of GAP forest actually sampled. As a result, the data representing GAP forest may be an inaccurate representation of GAP forest in its entirety. Future studies can take random samples over a larger portion of GAP forest in order to make more accurate comparisons. Additionally, other areas of the Georgetown University Campuses can be analyzed and compared with the GAP forest, or even with the North Lawn and other on-campus urban forests. In the end, an unexpected result occurred. I gained a novel appreciation for the landscape of Georgetown University. The landscape is a defining feature of this campus. In the years to come, I look forward to returning and seeing its evolution. Acknowledgements I thank E. M. Barrows, D. S. Kjar, and M. Pontti for their help with this project. Literature Cited Barrows, Edward M. 2001. Animal Behavior Desk Reference, Second Edition: A Dictionary of Behavior, Ecology, and Evolution. CRC Press, Boca Raton, FL. 922 pages. Barrows, Edward M. 2003a. Information Sheet, Glover-Archbold Park, Washington, D.C. Internet File. http://biodiversity.georgetown.edu/searchfiles/infosearch.cfm?view=all&IDNumber=1520 (20 December 2003)Barrows, Edward M. 2003b. Nature, Gardens, and Georgetown (unpublished).National Park Service. 1999. The National Park Service Organic Act. Internet file. http://www.nps.gov/legacy/organic-act.htm (25 December, 2003)
|
|||||||||||||||||||||||||||||||||||||||||||||||||||||||||||||||||||||||||||||||||||||
